
Activity Tracking & Analytics
Engage provides users with a variety of important analytics to measure the engagement of clients and prospects. Each contact has their own personal URL to the system, so each individual's usage can be tracked down to the second.
Many of those data points can also trigger automated messages to alert individuals when someone has logged in or completed other activities. Each workspace has two areas where you can view analytic activity
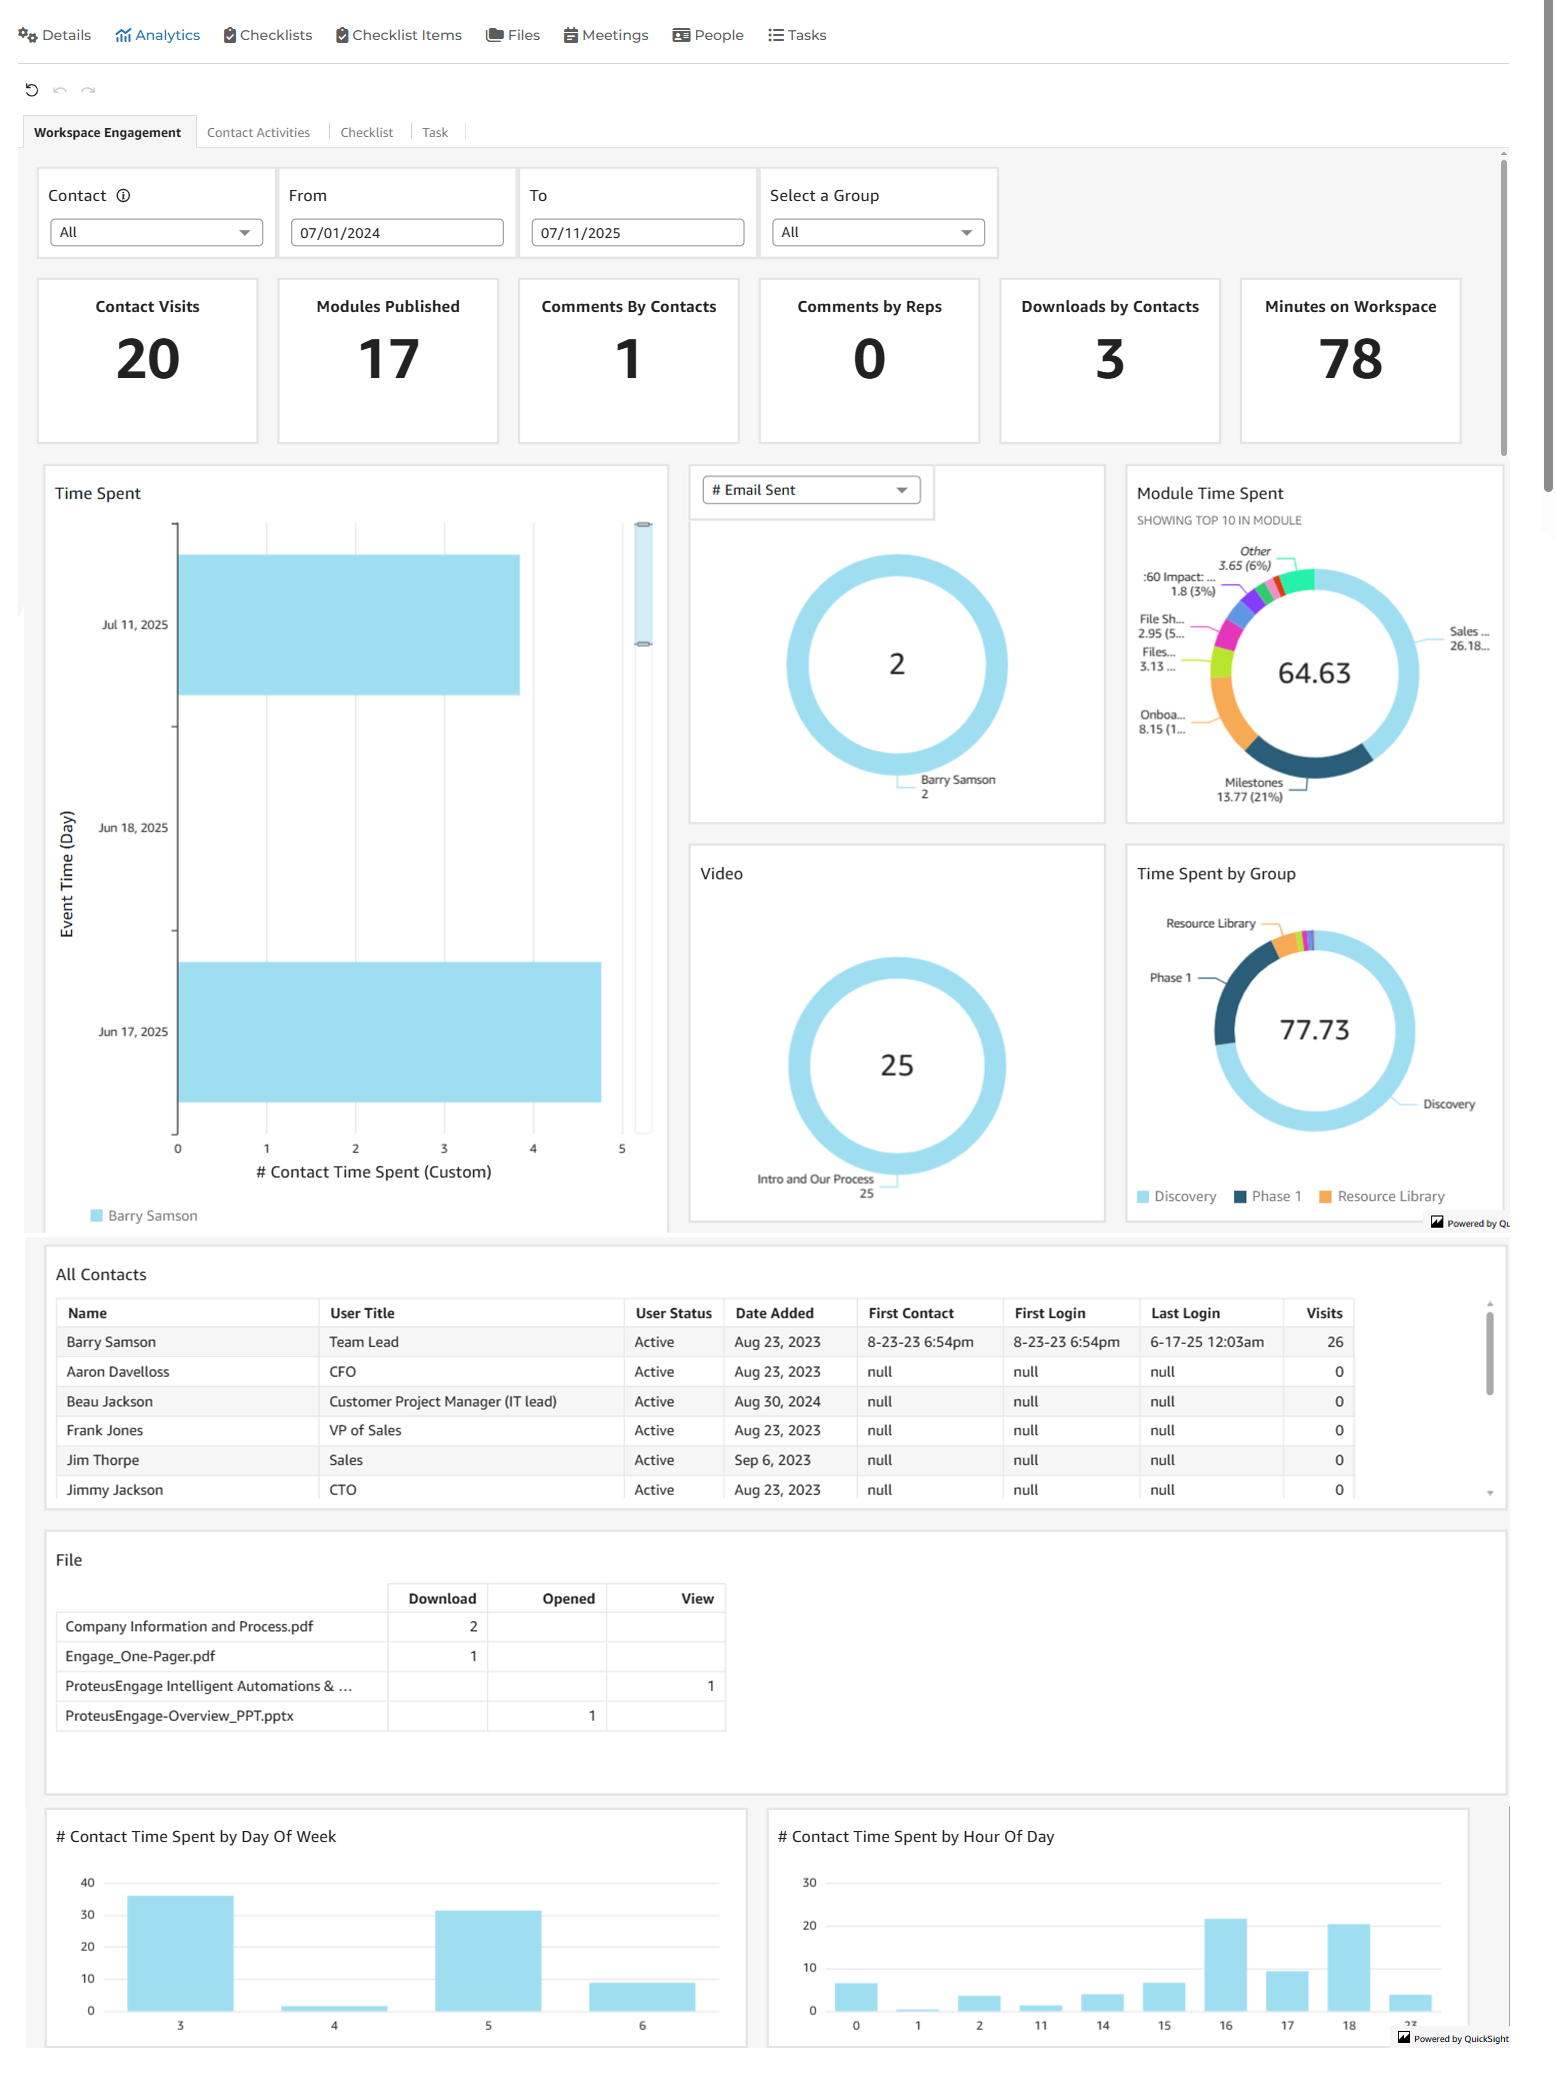
(1) Analytics
This is accessible under the "Analytics" tab of a workspace. This shows a visualization summary of how people are engaging with your workspaces, what contacts are doing inside your workspaces, status of any checklists, and how others are doing on their tasks. Each of these data points are represented in their own tab.
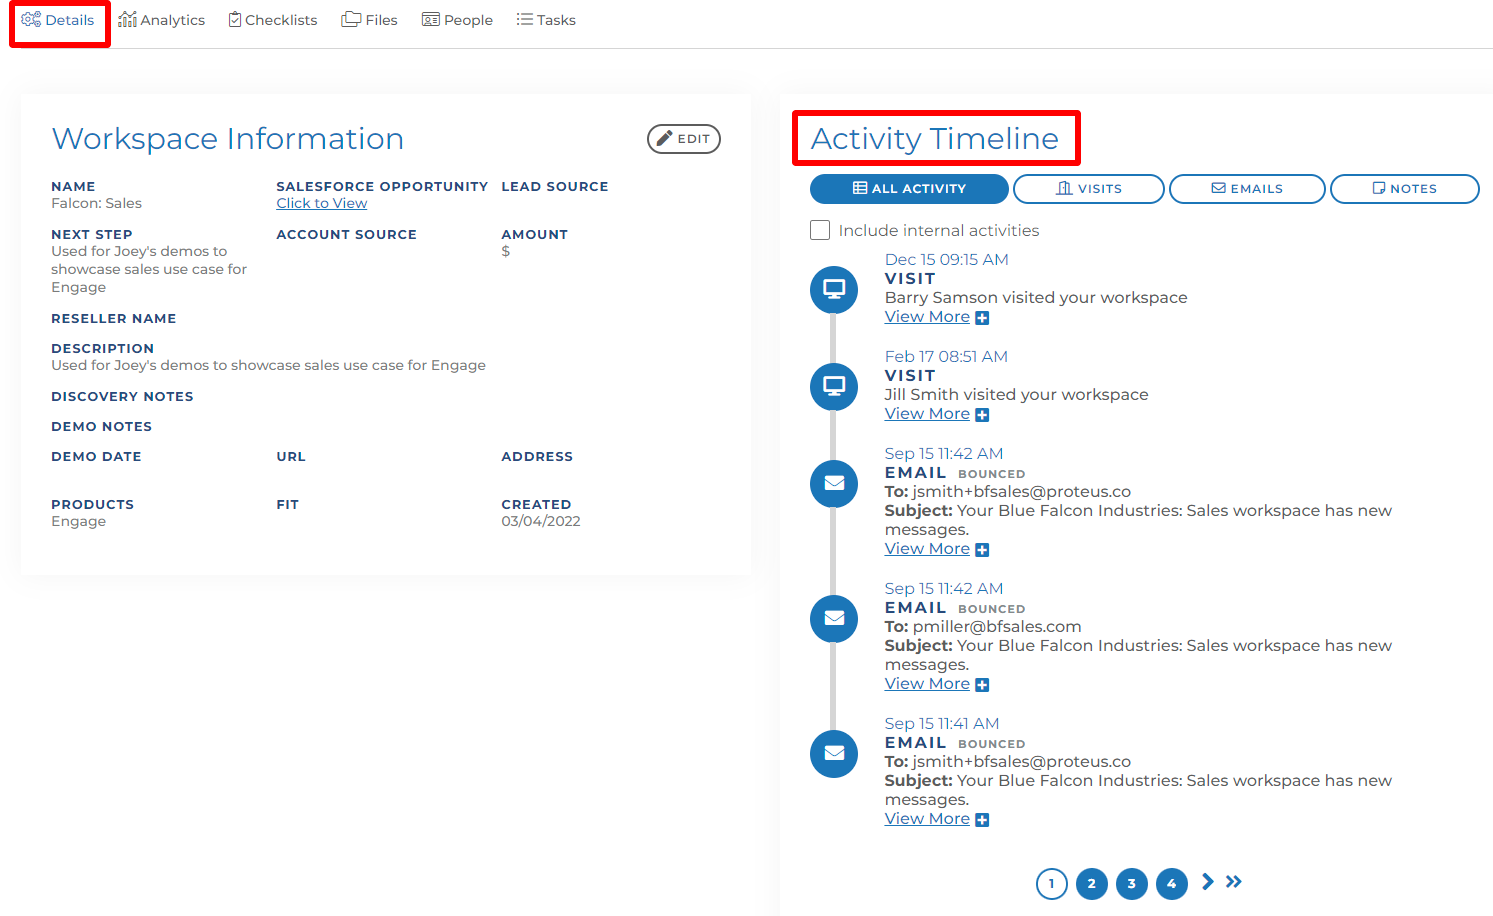
(2) Activity Timeline
This is accessible under the "Details" tab of a workspace. This shows a much more detailed view of the activity within this workspace.
As you can see, there is a "Include internal activities" check box. This check box is unchecked by default. When the box is unchecked, the activity displayed below involves only the workspace contacts. Checking this check box allows you to see the activity of all the reps on this workspace as well as the contact activity. This can be toggled on and off at any time.
There are several tabs in this section that allow you to filter the data.
All Activity tab: This tab is selected by default and shows you all the activity involving all contacts and reps within this workspace.
Visits tab: This tab shows only activity related to a contact visiting the workspace. The summary view shows you the date/time the visit was logged and the contact's name who visited. If you click the "view more" button on each visit, it will give you a detailed view of what the contact did inside the workspace during their visit. This includes how long they viewed certain modules, how much they watched of certain videos, if they invited anyone to the platform, etc.
Emails tab: This tab shows only activity related to emails. The summary view shows you the date and time this email was sent, the email address of the person who the email was sent to, and the subject of the email. If you click the "view more" button on each email, you can see exactly what the email looked like at the time it was sent.
Notes tab: This tab shows you any notes that have been submitted. Notes can only be submitted by users. These can be used to recap calls or other information that may not fit a current field inside your CRM.
(3) Scorecard
For each of our clients, we have a workspace for you inside our Engage site. We use this workspace for our relationship with you throughout the entire customer journey. If you need to be resent the link to access this workspace, please reach out to your customer success manager.
There is a group inside your workspace called "ENGAGEment". Inside this group there is a "Reports" module.
This module contains five different custom reports. These reports are similar to the Analytics tab of a workspace, but they involve data across your Engage site. These are some of the data points included in these reports:
Most engaged buyers in the last calendar month: Which of your workspaces/contact are showing the highest engagement score.
Modules published and contact actions by calendar quarter: Average amount of modules being published by month and engagement of those modules by contact.
Rep activity and engagement: Which of your reps are the most active and the average amount of modules being published by these reps.
Overall engagement throughout the site: How much time have your reps and contact spent inside the platform in the last year and the results of that activity.
Module success report: Which modules created the most engagement based on who viewed the modules and who didn't.
If there are specific data points you are looking for that are not included in the reports above, please contact support and we can build you a custom report of the data needed.